
Using the G.R.O.W.S method
Editor's note: I promised another prioritisation essay in last week's piece. This is it. Plus more. Much more. Similar to last weeks piece, best results from this approach happen when you have plugged as many holes as you can in that leaky bucket product of yours :)
In order to get the most out of your growth strategies, having a clear cut process in running growth experiments is paramount. As long as you approach this with some scientific methods - allowing any test to be analysed from a quantitative perspective - then you are on a good path.
A simple scientific experiment outlined below can be found in any secondary school textbook.

Minimum viable experiment
We will use the same concept, just in a more scalable way.
The key here is to have an unbiased decision making process when focusing your time, effort and money into finding your core growth channels. Putting your trust into a scientific growth experiment allows you to follow the data rather than your gut (don't get me wrong, your gut is very intuitive, but it won't be able to consistently tell you whether your multivariate-tests-of-the-future will work). It will ultimately help you make the most informed decisions you can in un-earthing the growth for your business.
There are a few ways (or anagrams) you can follow for your experiments, however, one that has worked for me is the G.R.O.W.S process, coined by the Growth Tribe out of Amsterdam.
G.R.O.W.S

The G.R.O.W.S method
The G.R.O.W.S process follows this order:
G - Gather Ideas
R - Rank Ideas
O - Outline Experiments
W - Work
S - Study Data
Let's dive in to each stage.
G - GATHER IDEAS

Trello board for backlogged ideas across the Pirate Metrics
Creating a company-wide spreadsheet for ideas that popup anytime is great way to start. How I organised our growth backlog is by using the conversion funnel (or pirate metrics) as a guide, going from awareness, acquisition, activation, retention, revenue and referral.
You can take things further by setting up formal brainstorming sessions with the whole company or multiple teams depending on size of co. To get the most out of these sessions, it's best to learn how to brainstorm like a Googler.
Simply put, the growth team ask every individual to brainstorm on their own around a specific stage of the conversion funnel, e.g. user acquisition. Everyone then comes together to flush out the best, most creative and innovative ideas to start ranking. Each person must:
Know the user
Think 10x
Prototype said ideas
R - RANK IDEAS
Next step is to rank or prioritise your ideas. If you take a look at my previous essay on how to prioritise your growth, I map out a prioritisation framework (Bullseye). You can use that or, since we are focusing on experimentation, you can create any simple ranking system to help rank best ideas. Such as:
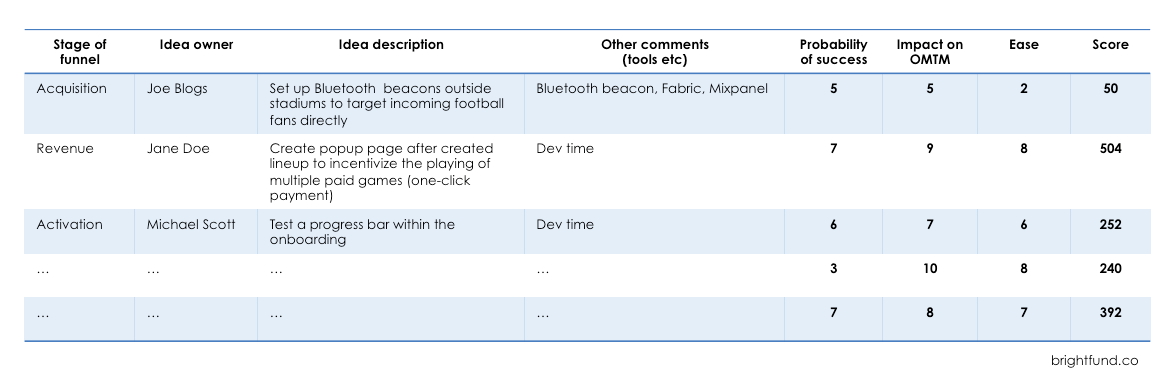
Who ate all the P.I.E.S
What I like about this system is the semi-scientific approach. Good tip is to make any decision a quant one. The image above shows a mixed variety, meaning ideas from different stages of the conversion funnel. It's actually best is to focus on one stage every time.
O - OUTLINE EXPERIMENTS
Now that you have one highest ranked idea, you can start experimenting. Key here is to design a test that will verify whether the specific idea/channel/approach will be a success or failure. Best way to go about this is to build out an experiment sheet.
Minimum viable version:

Minimum Viable Version
Top ranked idea: Create a popup page after created a lineup to incentivise users to play multiple paid games with one-click
Research: Currently we have paying users playing 2 paid games per gameday. This popup page will make it much easier to play more
Hypothesis: By using the popup page to incentivise more paid games, we will increase paid games per user per gameday by 50% and therefore increase average revenue per paying user (ARPPU) by 20%
Maximum viable version:
Top ranked idea: Create a popup page after created a lineup to incentivise users to play multiple paid games with one-click

Maximum Viable Version
Top ranked idea: Create a popup page after created a lineup to incentivise users to play multiple paid games with one-click
We believe that there will be an increase in paid games because of a popup screen that incentivises users to play more with one-click
To verify this we will send out a beta version with said integration to our top 5% users - without telling them the update - and analyse their behaviour when prompted
We will measure number of paid games played (#) and ARPPU (£) to see if there is an increase in either or both due to the integration
It is a success if we improve the ARPPU by 20%
Results Quantitative: # paid games played up by 75% and ARPPU up by 33%
Results Qualitative: users say "very useful", "quick and easy", "organic placement of popup", "much more fun, quick and useful"
Next steps are to rollout integration and update game
W - WORK WORK WORK

Rihanna says it best
This the area that separates the men and women from the boys and girls. You can do a number of things to maximise the effectiveness of your work and experiment, however for me, weekly sprints worked best. They really allow you to laser focus on one goal (the experiment) and truly smash it out the park. No excuses.
S - STUDY DATA

Which pill...?
This is where the insights kick in and you make your growth decisions. This is where the test is verified as either a success or failure.
If you get the analysis wrong, you make the wrong decisions. Therefore you could jeopardise your whole growth model. Which could mean the end of your business, depending on its stage of life. No pressure.
Make sure you understand, record and analyse both quantitative and qualitative data for every experiment. Understanding how the users reacted and felt, matter as much as the data behind their behaviour.
Try to find any differences in user behaviour from before, and ask yourself why this has (or has not) occurred. Does it fit with your original hypothesis? Is this healthy, scalable behaviour?
From all of the data you have acquired and consumed you can now conclude success or failure. And depending on answer, either use the data for further background research in future projects, or use to rollout the experiment company-wide.
Key tools I used were Fabric.io (for real-time acquisition metrics), Amplitude (for retention, segmenting, behavioural cohorting, data visualisation and Metabase (for all data retrieval and querying).
RINSE AND REPEAT

Rinse and repeating growth experiments
Even if your first seven experiments fail, you can use the data acquired as more background research for the next seven. This iterating experimentation process theoretically means the more experiments you run the higher value they become (so by experiment 1,273 you'll be pooping gold).
Remember, rinse and repeat until you find that one core channel that really grows your business. The one that hits the sweet spot. When you do, ride that channel as long as you can, dig deep, iterate and squeeze as much growth as you can out of it until it's fully saturated.
Then rinse. Then repeat.